What is API Observability? Logs, Metrics, Traces Explained
The hardest outages aren't when systems go down-they're when you have no idea what's happening inside. API observability is how you make your system explorable in real time.

Think of API observability as a flight data recorder-the black box in an aircraft. When everything is smooth, nobody looks at it. But when turbulence or failure hits, it's the only source that tells the full story of what happened and why.
For APIs, observability means having enough context-through logs, metrics, and traces-that you can ask new questions about system behaviour without changing code or redeploying. Monitoring tells you if a system is alive. Observability lets you ask why it's misbehaving.
Key Pillars of Observability
Logs are records of events that occur within the API environment. They provide a comprehensive view of what happens during API operations, making it easier to troubleshoot issues. Logs typically include:
- Timestamp: When the event occurred. This allows teams to search logs for specific timeframes.
- Event Type: The nature of the event (e.g., error, warning, info).
- Message: A description of the event. By analyzing logs, teams can identify patterns and recurring problems, such as a broken endpoint or misconfigured server.
Advantages of Logs: They give the rawest form of truth. With structured logging, you can quickly search, filter, and correlate issues. Logs are also critical for compliance audits and forensic analysis.
Metrics
Metrics are numerical summaries that track performance over time. They highlight system health and usage trends. Key metric components include:
- Throughput: How many requests per second your API is serving.
- Latency: How long each request takes, often measured in percentiles (p95, p99).
- Error Rate: The percentage of failed requests, helping spot reliability issues.
- Resource Utilization: CPU, memory, or bandwidth consumption by services.
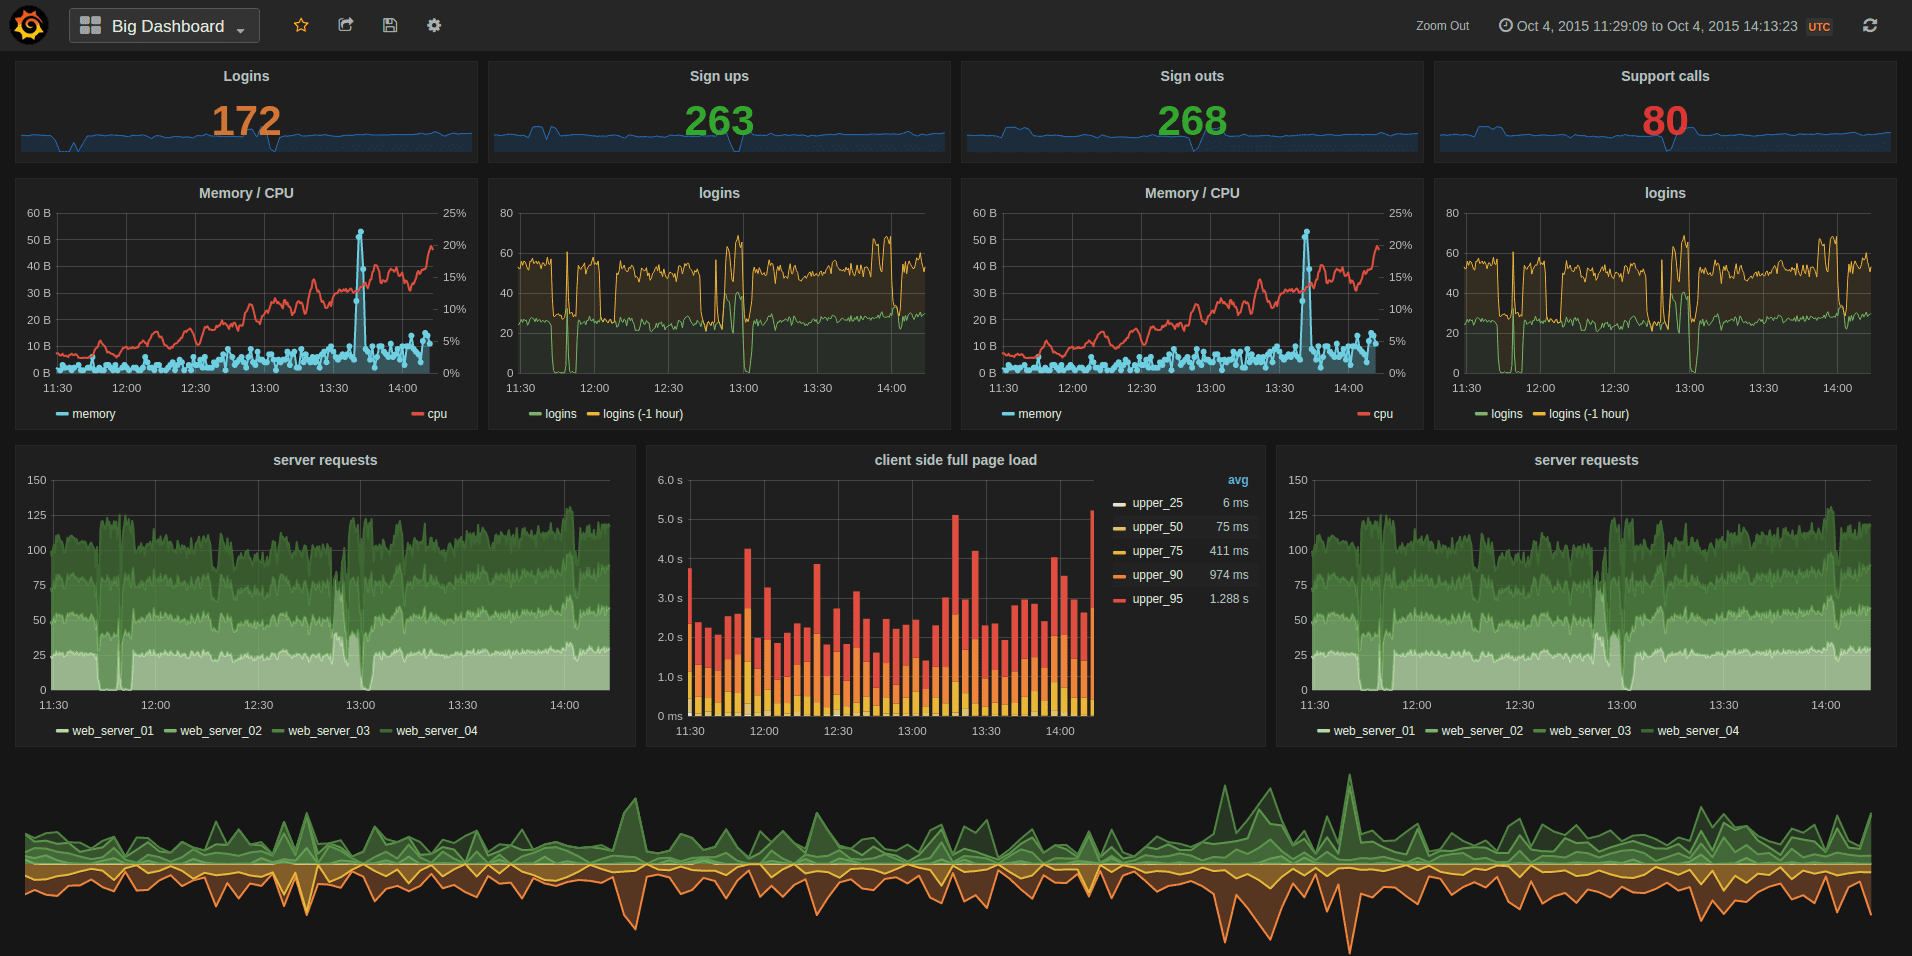
Advantages of Metrics: Metrics provide fast, aggregated insights. They are lightweight, cheap to store, and ideal for setting up alerts. Prometheus is the go-to open source standard for metrics, and with Grafana, teams can visualize trends clearly.
Traces
Traces capture the end-to-end journey of a single request across multiple services. They allow teams to see where time is spent and where errors occur. Elements of a trace include:
- Spans: Each operation (database query, cache lookup, API call) becomes a span in the trace.
- Latency Distribution: How much time each span contributes to the overall request.
- Dependency Map: Visualizing how services interact and where bottlenecks form.
Advantages of Traces: Traces provide deep visibility across microservices. They are invaluable for debugging complex, distributed systems where a single request may touch dozens of services.
Bonus: Correlation
Correlation ties everything together. It enables you to move seamlessly from metrics to logs to traces, creating a complete picture of an issue. Instead of looking at fragmented data, correlation lets engineers jump from a metric spike, to the specific trace, and finally to the logs that explain what went wrong. This reduces mean time to resolution (MTTR) dramatically.
How Does API Observability Work?
Tools like OpenTelemetry (for instrumentation), Prometheus (for metrics), and Grafana (for visualization) form the backbone of modern observability. They capture logs, metrics, and traces, then stitch them into a narrative you can explore. With correlation, you can slice requests by user, endpoint, or geography, and quickly see where latency, errors, or bottlenecks are forming.
For larger infrastructures, managed logging from AWS CloudWatch or GCP Cloud Logging can provide deep insights during critical incidents-though costly, they often pay for themselves in reduced downtime during a crisis.
How to Take Advantage of API Observability
The real value of observability is speed to insight. Use it to answer specific questions quickly, then wire those answers into habits, alerts, and product decisions.
1. Performance Debugging
Pinpoint why an endpoint is slow and who it affects.
- Baseline the golden signals: latency, traffic, errors, saturation. Start with p50, p95, p99.
- Slice by dimensions:
endpoint,method,region,version,tenant_id. - PromQL examples:
- Grafana dashboard tips: one panel per question, not per metric. Add drilldowns to traces and logs using
trace_id.
Error rate per endpoint:
sum(rate(http_requests_total{status=~"5.."}[5m])) by (endpoint)
/
sum(rate(http_requests_total[5m])) by (endpoint)
p95 latency per endpoint:
histogram_quantile(0.95, sum(rate(http_request_duration_seconds_bucket[5m])) by (le, endpoint))
2. Error Correlation
Find the real cause faster by linking signals.
- Attach a request ID to every hop and propagate as
trace_idandspan_idvia OpenTelemetry. - Structured logs must include:
timestamp,level,service,endpoint,status,trace_id,user_idortenant_idwhere allowed. - Workflow: alert fires on error spike _ jump to affected traces _ open logs for the slowest spans _ identify failing dependency.
3. Release and Version Verification
Prove a new release is safe within minutes.
- Label everything with
app_versionanddeployment_env. - Compare before vs after: overlay latency and error rate for
app_versionacross the same endpoints. - Guardrails: temporary SLOs for the new version. Auto rollback if burn rate exceeds threshold.
4. Cost and Efficiency
Use observability to reduce waste without breaking SLAs.
- Track cost proxies: CPU seconds per request, DB queries per call, cache hit ratio.
- PromQL examples:
- Decision: refactor hot endpoints, add caching, or split read vs write paths.
Cache hit ratio:
sum(rate(cache_hits_total[5m])) / (sum(rate(cache_hits_total[5m])) + sum(rate(cache_misses_total[5m])))
CPU seconds per request:
sum(rate(container_cpu_usage_seconds_total[5m])) by (service)
/
sum(rate(http_requests_total[5m])) by (service)
5. Capacity Planning
Predict where things break and how much headroom you have.
- Saturation metrics: queue length, connection pool usage, goroutines or threads, DB CPU.
- Traffic modeling: use p99 as your safety lens, not average.
- Load test loop: generate traffic at 1x, 2x, 5x, 10x current peak and record the first component that saturates.
- Plan: set autoscaling rules on leading indicators like queue depth and CPU, not just request count.
7. User Impact and Customer Communication
Know exactly who is affected and by how much.
- Tag by tenant or plan where legally allowed:
tenant_id,plan=tier. - Dashboards that show errors and latency by customer segment help prioritize.
- Status updates: use the same metrics for public status pages and customer emails to keep comms honest.
8. Security and Compliance Forensics
Answer the who, what, when questions quickly.
- Retain logs with tamper-evident storage for the required period.
- Search patterns for suspicious access and failed auth spikes.
- Cloud logs: CloudWatch Logs and Cloud Logging are costly at scale but invaluable during incidents for cross-service queries.
The Takeaway
Observability is not just a technical luxury, it's the foundation of reliable APIs. With well-instrumented logs, metrics, and traces, teams can see what's really happening under the hood instead of guessing. The payoff is faster debugging, clearer capacity planning, and the confidence to ship changes without fear. For founders and engineers, investing early in observability is like buying insurance for your growth-when problems come, you'll have the clarity to respond instead of scrambling in the dark.